Market Outlook
March 19, 2018
Market Cues
Domestic Indices
Chg (%)
(Pts)
(Cl ose)
Indian markets are likely to open flat tracking global indices and SGX Nifty.
BSE Sensex
(1.5)
(510)
33,176
U.S. stocks moved mostly higher during trading following the mixed performance
Nifty
(1.6)
(165)
10,195
seen in the previous session. The Dow Jones climbed to 0.3% to close at 24,947.
Mid Cap
(1.1)
(176)
16,219
The NASDAQ dropped down by 0.1% to close at 7,482.
Small Cap
(1.0)
(178)
17,576
U.K. stocks recovered from early losses to trade slightly higher after house builder
Bankex
(1.1)
(313)
27,610
Berkeley Group warned on production constraints in London and the south east. The
FTSE 100 was up by 0.3% to end at 7,164.
Global Indices
Chg (%)
(Pts)
(Cl ose)
On domestic front tumbled during the last trading session, with financial, metal and
Dow Jones
0.3
73
24,947
energy stocks coming under heavy selling pressure, as trade-war worries persisted
Nasdaq
0.0
0
7,482
and reports suggested that special counsel Robert Mueller has subpoenaed U.S.
FTSE
0.3
24
7,164
President Donald Trump's businesses, adding to the sense of continued political
Nikkei
(0.6)
(127)
21,677
uncertainty in the U.S. The BSE Sensex ended down by 1.5% at 33,176.
Hang Seng
(0.1)
(39)
31,502
News Analysis
Shanghai Com
(0.6)
(21)
3,270
L&T wins Rs 28.6 billion worth package for Eastern Freight corridor
Detailed analysis on Pg2
A dvances / Declines
BSE
NSE
Advances
861
534
Investor’s Ready Reckoner
Declines
1,844
1,263
Key Domestic & Global Indicators
Unchanged
155
70
Stock Watch: Latest investment recommendations on 150+ stocks
Refer Pg5 onwards
Volumes (` Cr)
Top Picks
BSE
3,684
C MP
Target
U psi de
C ompany
Sector
R ating
(`)
(`)
(%)
NSE
41,936
Blue Star
Capital Goods
Accumulate
785
867
10.5
Dewan Housi ng Finance Financials
Buy
510
720
41.1
Net Inflows (` Cr)
Ne t
Mtd
Ytd
Century Plyboards
Forest Product
Buy
327
400
22.5
FII
(193)
8,098
8,590
Navkar Corporation
Others
Buy
162
265
63.8
*MFs
(273)
(455)
24,750
KEI Industrie s
Capital Goods
Buy
368
436
18.5
More Top Picks on Pg4
Top Gainers
Price (`)
Chg (%)
Key Upcoming Events
Previous
C onsensus
JPASSOCIAT
21
9.1
D ate
Region
Event Description
Reading
Expectations
SINTEX
20
8.9
Mar 20
Euro Zone Euro-Zone Consumer Confidence
0.10
0.10
MMTC
67
8.3
Mar 20
UK
Joble ss claims change
(7.20)
Mar 21
UK
CPI (YoY)
3.00
2.80
VAKRANGEE
248
4.7
Mar 21
US
Existing home sales
5.38
5.43
ADANITRANS
191
4.3
Mar 21
US
FOMC rate decision
1.50
1.75
More Events on Pg7
Top Losers
Price (`)
Chg (%)
KWALITY
91
-7.2
NIITTECH
926
-6.3
GDL
193
-5.8
COX&KINGS
237
-5.8
BBTC
1204
-5.6
As on March 16, 2018
Market Outlook
March 19, 2018
News Analysis
L&T wins Rs 28.6 billion worth package for Eastern Freight corridor
L&T has won a single-track corridor package on the eastern dedicated freight
corridor worth Rs 28.64 billion for construction of the 222km line. "This is Larsen &
Toubro's first EPC Civil, Structure & Track project in the Eastern Dedicated Freight
Corridor. In the Western Dedicated Freight Corridor, L&T already has a share of
71 per cent in the civil packages and 100 per cent share in the electrical
packages".
Dedicated Freight Corridor Corporation of India (DFCCIL) is a special purpose
vehicle of the Indian Railways, mandated to build dedicated freight corridors. The
project won by L&T will be funded by World Bank (WB) and is a part of the 1856
km Eastern Corridor.
Economic and Political News
Oct-Dec current account deficit sharply widens on higher imports
PNB scam fallout: Assocham survey shows up to 15% drop in diamond
demand
Government to test Rs 10 plastic note, won't discontinue Rs 2,000 note
No shortage of land or funds for affordable housing projects
Corporate News
Bharti Airtel receives more than 1.5 mn Aircel customers in Tamil Nadu
ITC to file 3rd FIR against videos showing plastic in 'Aashirvaad Atta'
L&T wins Rs 28.6 billion worth package for Eastern Freight corridor
Market Outlook
March 19, 2018
Top Picks
Market Cap
C MP
Target
Upside
C ompany
R ationale
(` Cr)
(`)
(`)
(%)
Strong growth in domestic business due to its
leadership in acute therapeutic segment. Alkem
Alkem Laboratories
25,805
2,158
2,441
13.1
expects to launch more products in USA, which bodes
for its international business.
Favorable outlook for the AC industry to augur well for
Cooling products busine ss which is out pacing the
Blue Star
7,531
785
867
10.5
market growth. EMPPAC division's profitability to
improve once operating environment turns around.
With a focus on the low and medium income (LMI)
consumer segment, the company has increased its
Dewan Housi ng Finance
16,001
510
720
41.1
presence in tier-II & III cities where the growth
opportunity i s immense.
Well capitalized with CAR of
18.1% which give s
sufficient room to grow asset base. Faster resolution of
ICICI Bank
1,91,555
298
416
39.6
NPA would reduce provision cost, which would help to
report better ROE.
High order book execution in EPC segment, rising B2C
KEI Industrie s
2,884
368
436
18.5
sales and higher exports to boost the revenues and
profitability
Expected to benefit from the lower capex requirement
Music Broadcast Limited
2,080
365
475
30.3
and 15 ye ar long radio broadcast licensing.
Massive capacity expansion along with rail advantage
Navkar Corporation
2,435
162
265
63.8
at ICD as well CFS augur well for the company
Strong brands and distribution network would boost
Siyaram Silk Mills
3,018
644
851
32.2
growth going ahead. Stock currently trade s at an
inexpensive valuation.
Market leadership in Hi ndi news genre and no.
2
viewership ranking in English news genre, exit from the
TV Today Network
3,109
521
552
5.9
radio business, and anticipate d growth i n ad spends
by corporate to benefit the stock.
After GST, the company is expected to see higher
volume s along with improving product mix. The
Maruti
2,62,518
8,690
10,619
22.2
Gujarat plant will also e nable higher operating
leverage which will be margin accretive.
We expect loan book to grow at 24.3% over next two
GIC Housing
2,124
394
655
66.1
year; change in borrowing mix will help in NIM
improve ment
We expect CPIL to report net Revenue/PAT CAGR of
~17%/ 16% over FY2017-20E mainly due to he althy
Century Plyboards
7,256
327
400
22.5
growth in plywood & lamination busi ness, forayed into
MDF & Particle boards on back of strong brand &
distribution network.
We expect sales/PAT to grow at 13.5%/20% over next
LT Foods
2,789
87
128
46.8
two years on the back of strong distribution network &
addition of new products in portfolio.
Third largest brand pl ay in luggage segment Increased
product offerings and improving distri bution network is
Safari Industries
1,180
530
650
22.6
leading to strong growth in business. Likely to post
robust growth for next 3-4 years
We expect HSIL to report PAT CAGR of ~15% over
FY2017-20E owing to better improve ment in operating
HSIL Ltd
2,923
404
510
26.1
margin due price hike in container glass segment,
turnaround in consumer business.
We expect financialisation of savings and increasing
Aditya Birla Capital
33728
148
218
41.5
penetration in Insurance & Mutual fund would ensure
steady growth.
Source: Company, Angel Research
Market Outlook
March 19, 2018
Fundamental Call
Market Cap
C MP
Target
Upside
C ompany
R ationale
(` Cr)
(`)
(`)
(%)
CCL is likely to maintain the strong growth trajectory
CCL Products
3,924
295
360
22.0
over FY18-20 backed by capacity expansi on and new
geographical foray
We forecast Nilkamal to report top-line CAGR of ~9%
to `2,635cr over FY17-20E on the back of healthy
Nilkamal
2,446
1,639
2,178
32.8
demand growth in pl astic division. On the bottom -line
front, we estimate ~10% CAGR to `162cr owing to
improve ment in volumes.
We expect sales/PAT to grow at 9%/ 14% over next two
years on the back of healthy demand growth in
Shreyans Industries
205
148
247
66.4
printing. Further, China had banned maki ng paper
from waste pulp which would benefit Indian paper
companie s.
The prism has diversified exposure in the different
segment such as Cement, Tile & ready mix concrete.
Prism Cement
5,821
116
160
38.3
Thus we believe, PCL is in the right place to capture
ongoing government spendi ng on affordable housing
and infrastructure projects.
Elantas Beck India is the Indian market leader in liquid
insulation segment use d in electrical equipments like
Elantas Beck India Ltd
1,609
2,029
2,500
23.2
motors, transformers etc. It derives demand from
several industries which are expected to register 10%+
CAGR in demand in the coming years.
RPL to report healthy top-line CAGR of ~13% over
FY17-20E on the back of healthy de mand in printing &
Ruchira Papers Ltd.
389
173
244
40.8
writing paper segments. On the bottom-line front, we
estimate ~16% CAGR over FY17-20E owing to strong
improve ment in operating performance.
Greenply Industries Ltd (GIL) manufactures plywood &
allied products and medium density fibreboards
(MDF). GIL to report net reve nue CAGR of ~14% to
Greenply Industries
4,096
334
395
18.3
~`2,478cr over F Y2017-20E mainly due to healthy
growth in plywood & lamination busine ss on the back
of strong brand and di stribution network
Source: Company, Angel Research
Market Outlook
March 19, 2018
Key Upcoming Events
Global economic events release calendar
Bloomberg Data
Date
Time Country
Event Description
Unit
Period
Last Reported
Estimated
Mar 20, 2018
8:30 PMEuro Zone
Euro-Zone Consumer Confidence
Value
Mar A
0.10
0.10
3:00 PMUK
Jobless claims change
% Change
Feb
(7.20)
Mar 21, 2018
3:00 PMUK
CPI (YoY)
% Change
Feb
3.00
2.80
7:30 PMUS
Existing home sales
Million
Feb
5.38
5.43
11:30 PMUS
FOMC rate decision
%
Mar 21
1.50
1.75
Mar 22, 2018
6:00 PMUS
Initial Jobless claims
Thousands
Mar 17
226.00
2:00 PMGermany
PMI Services
Value
Mar P
55.30
55.20
2:00 PMGermany
PMI Manufacturing
Value
Mar P
60.60
59.80
5:30 PMUK
BOE Announces rates
% Ratio
Mar 22
0.50
0.50
Mar 23, 2018
7:30 PMUS
New home sales
Thousands
Feb
593.00
620.00
Mar 27, 2018
7:30 PMUS
Consumer Confidence
S.A./ 1985=100
Mar
130.80
Mar 28, 2018
6:00 PMUS
GDP Qoq (Annualised)
% Change
4Q T
2.50
Mar 29, 2018
1:25 PMGermany
Unemployment change (000's)
Thousands
Mar
(22.00)
6:30 AMChina
PMI Manufacturing
Value
Mar
50.30
Mar 31, 2018
2:00 PMUK
GDP (YoY)
% Change
4Q F
1.40
Apr 03, 2018
2:00 PMUK
PMI Manufacturing
Value
Mar
55.20
Apr 05, 2018
2:30 PMIndia
RBI Reverse Repo rate
%
Apr 5
5.75
2:30 PMIndia
RBI Repo rate
%
Apr 5
6.00
2:30 PMIndia
RBI Cash Reserve ratio
%
Apr 5
4.00
Apr 06, 2018
6:00 PMUS
Change in Nonfarm payrolls
Thousands
Mar
313.00
6:00 PMUS
Unnemployment rate
%
Mar
4.10
Apr 10, 2018
US
Producer Price Index (mom)
% Change
Mar
(0.30)
Apr 11, 2018
6:00 PMUS
Consumer price index (mom)
% Change
Mar
0.20
7:00 AMChina
Consumer Price Index (YoY)
% Change
Mar
2.90
Source: Bloomberg, Angel Research
Market Outlook
March 19, 2018
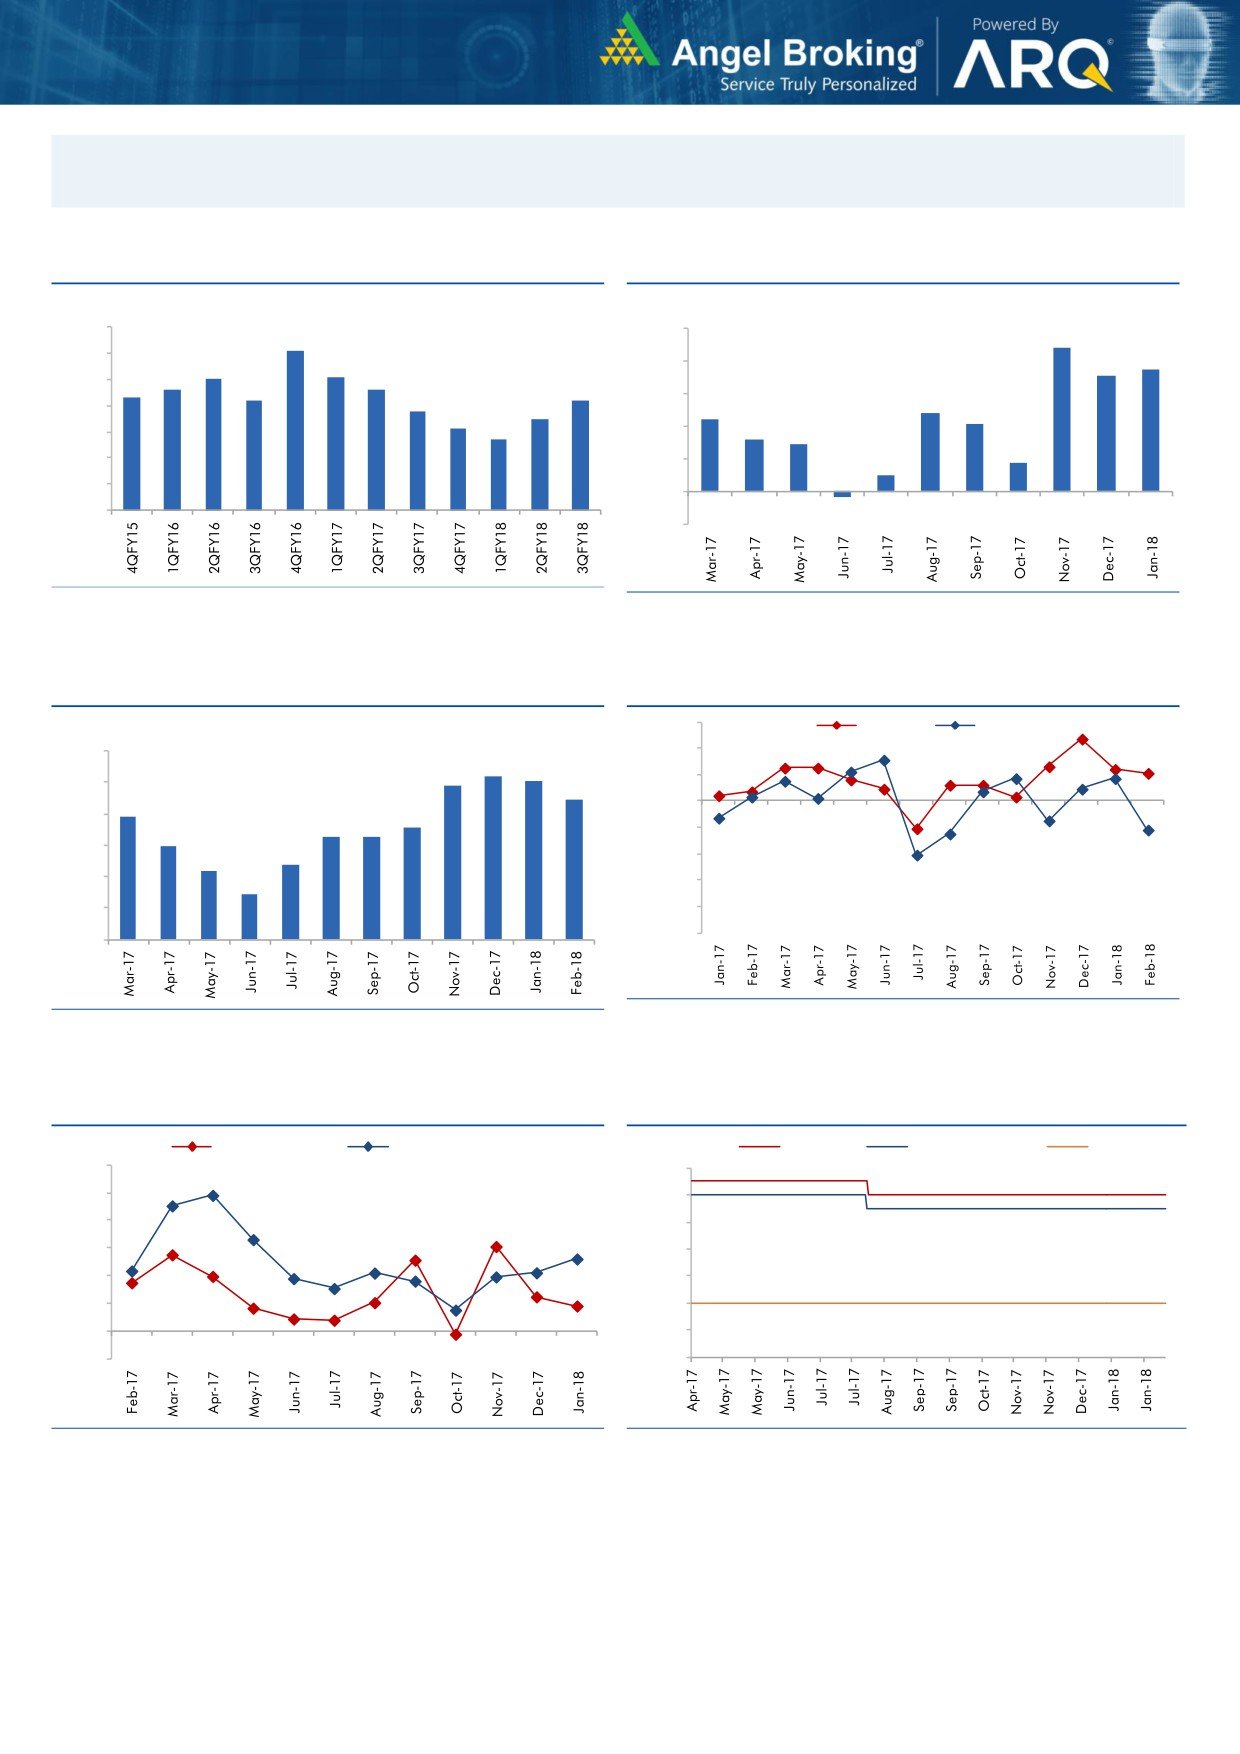
Macro watch
Exhibit 1: Quarterly GDP trends
Exhibit 2: IIP trends
(%)
(%)
10.0
10.0
9.1
8.8
9.0
7.5
8.0
8.1
8.0
7.1
7.6
7.6
8.0
7.3
7.2
7.2
6.8
6.0
4.8
7.0
6.5
4.4
6.1
4.1
5.7
4.0
3.2
2.9
6.0
1.8
5.0
2.0
1.0
4.0
-
3.0
(0.3)
(2.0)
Source: CSO, Angel Research
Source: MOSPI, Angel Research
Exhibit 3: Monthly CPI inflation trends
Exhibit 4: Manufacturing and services PMI
56.0
Mfg. PMI
Services PMI
(%)
6.0
54.0
5.2
5.1
4.9
52.0
5.0
4.4
3.9
50.0
4.0
3.6
3.3
3.3
3.0
48.0
3.0
2.4
2.2
46.0
2.0
1.5
44.0
1.0
42.0
40.0
-
Source: Market, Angel Research; Note: Level above 50 indicates expansion
Source: MOSPI, Angel Research
Exhibit 5: Exports and imports growth trends
Exhibit 6: Key policy rates
(%)
Exports yoy growth
Imports yoy growth
(%)
Repo rate
Reverse Repo rate
CRR
60.0
6.50
50.0
6.00
40.0
5.50
30.0
5.00
20.0
4.50
10.0
4.00
0.0
3.50
(10.0)
3.00
Source: Bloomberg, Angel Research
Source: RBI, Angel Research
Market Outlook
March 19, 2018
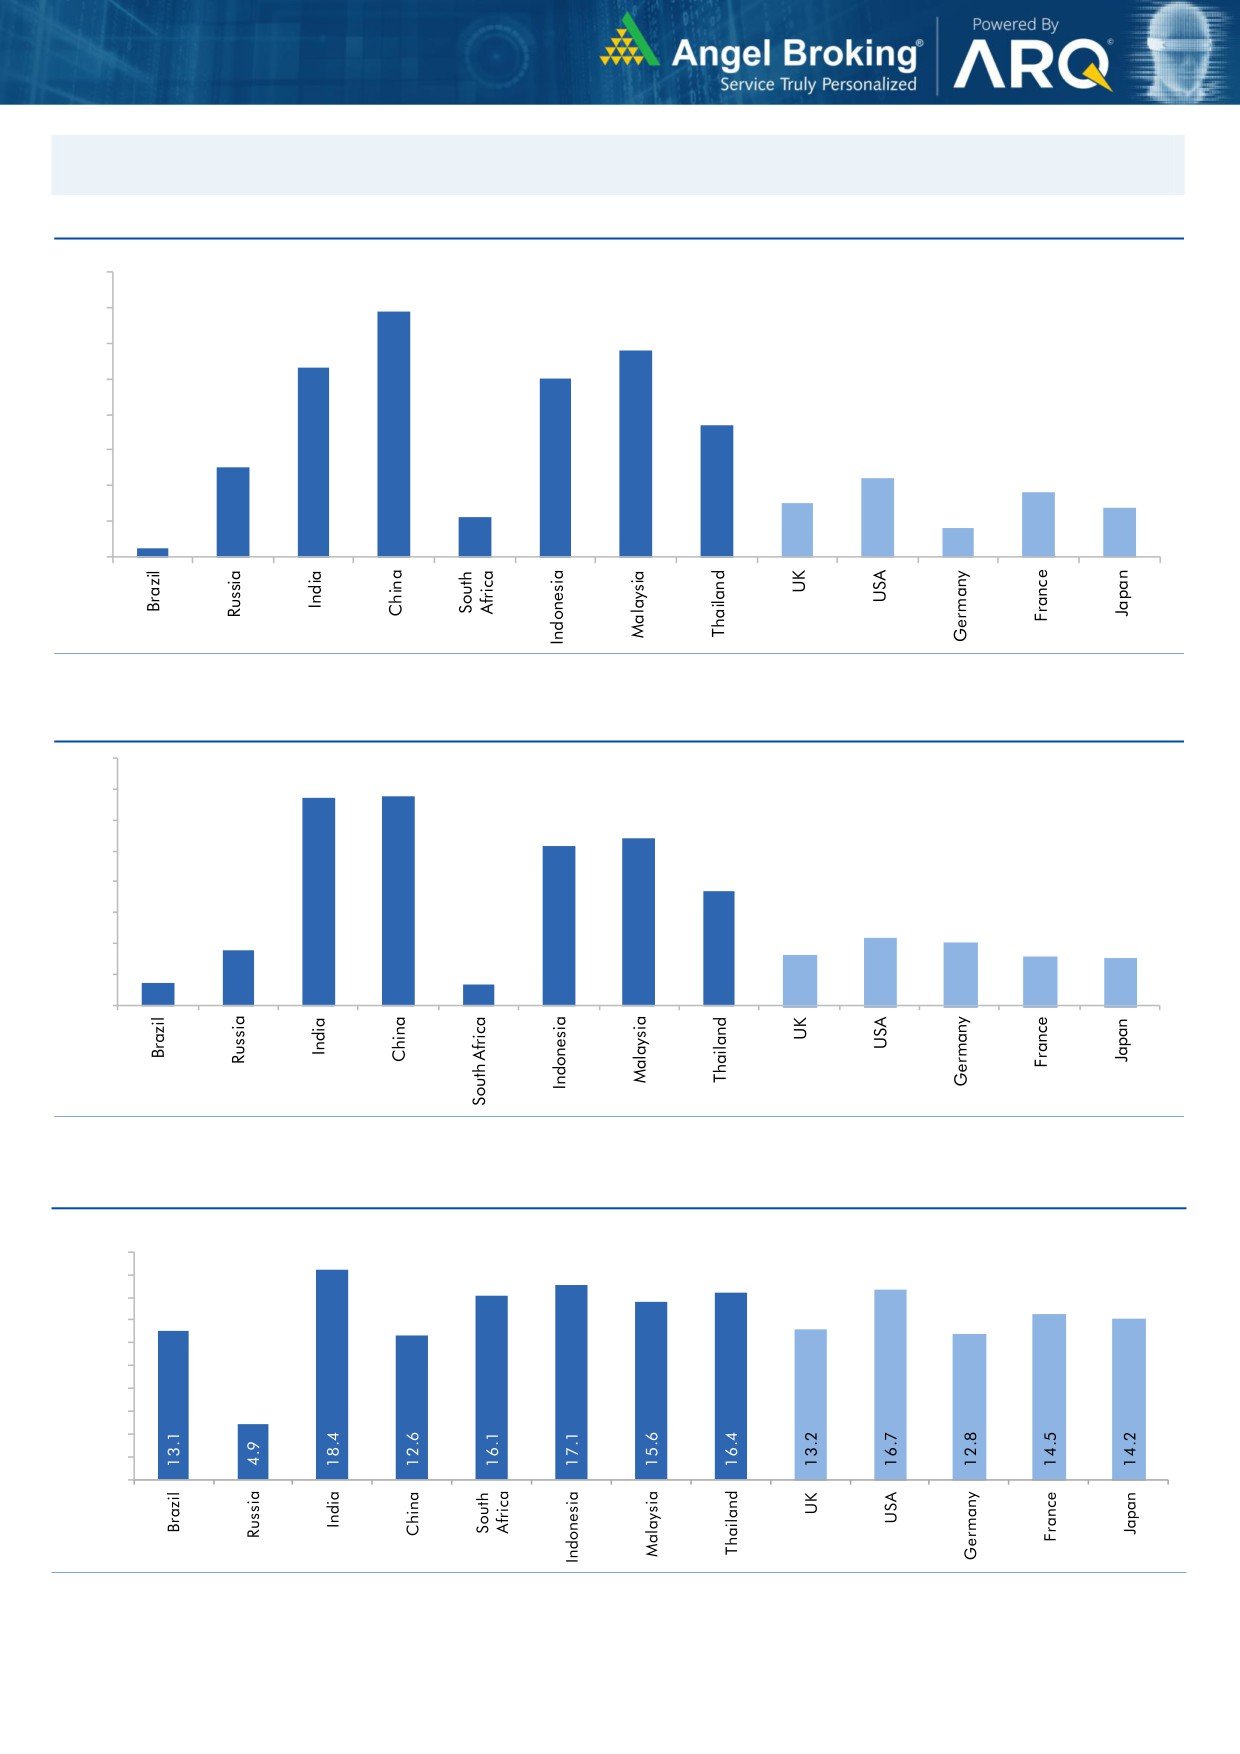
Global watch
Exhibit 1: Latest quarterly GDP Growth (%, yoy) across select developing and developed countries
(%)
8.0
6.9
7.0
5.8
6.0
5.3
5.0
5.0
1.1
3.7
4.0
2.5
3.0
2.2
1.8
2.0
1.5
1.4
0.8
1.0
0.3
-
Source: Bloomberg, Angel Research
Exhibit 2: 2017 GDP Growth projection by IMF (%, yoy) across select developing and developed countries
(%)
6.7
6.8
7.0
6.0
5.4
5.2
5.0
3.7
4.0
3.0
1.8
2.2
2.0
1.7
1.6
2.0
0.7
1.5
0.7
1.0
-
Source: IMF, Angel Research
Exhibit 3: One year forward P-E ratio across select developing and developed countries
(x)
20.0
18.0
16.0
14.0
12.0
10.0
8.0
6.0
4.0
2.0
-
Source: IMF, Angel Research
Market Outlook
March 19, 2018
Exhibit 4: Relative performance of indices across globe
Returns (%)
Country
Name of index
Closing price
1M
3M
1YR
Brazil
Bovespa
84,886
1.6
16.7
31.4
Russia
Micex
2,295
3.4
6.8
13.9
India
Nifty
10,195
(3.3)
(0.4)
12.2
China
Shanghai Composite
3,270
(1.2)
(0.6)
0.9
South Africa
Top 40
51,422
1.7
0.5
15.2
Mexico
Mexbol
47,478
(1.9)
(1.7)
(1.2)
Indonesia
LQ45
1,037
(6.5)
1.8
16.2
Malaysia
KLCI
1,846
0.7
7.4
7.0
Thailand
SET 50
1,192
2.4
8.0
21.7
USA
Dow Jones
24,947
1.2
1.8
19.3
UK
FTSE
7,164
(0.7)
(4.4)
(3.6)
Japan
Nikkei
21,677
2.5
(5.5)
12.2
Germany
DAX
12,390
0.4
(5.6)
2.4
France
CAC
5,283
2.3
(2.2)
5.8
Source: Bloomberg, Angel Research p68in4